Watercolor Mixing Chart
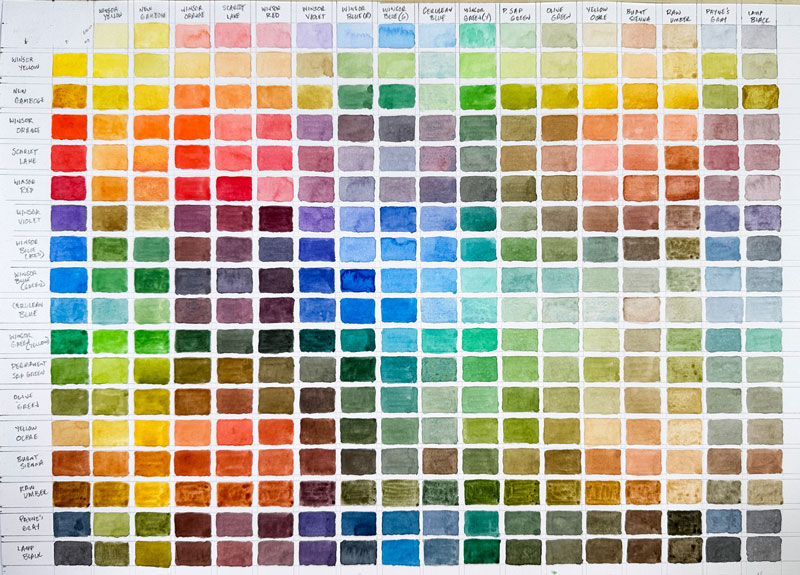
Creating a watercolor mixing chart is a great exercise to see what colors you can create with the watercolors that you have. By making your own chart, you’ll have a better understanding of how your colors will mix and you’ll discover new exciting colors. In this watercolor painting lesson, we’ll create a watercolor mixing chart. I’ll break down how to lay out your chart to maximize its benefits. Here’s a look at the completed chart we’ll create in this lesson…
Preparing the Watercolor Chart
The first step is to create your gridded chart. Be sure to create your chart on watercolor paper so that you can reduce buckling of the paper and get clean, bold color mixtures. For my chart, I chose to work on hot pressed watercolor paper, which provides a smooth surface. Cold pressed watercolor paper is another excellent choice.
Before drawing your grid, you’ll first need to count the colors. For my chart, I used my set of professional watercolors by Winsor and Newton which has 17 colors. This means that my grid will consist of 17 rectangles by 17 rectangles. I also chose to create a staggered chart so that I could create 2 different intensity versions of each color mixture. Be sure to work on a paper that is large enough to accommodate the entire grid.
Here’s a look at the grid I created…
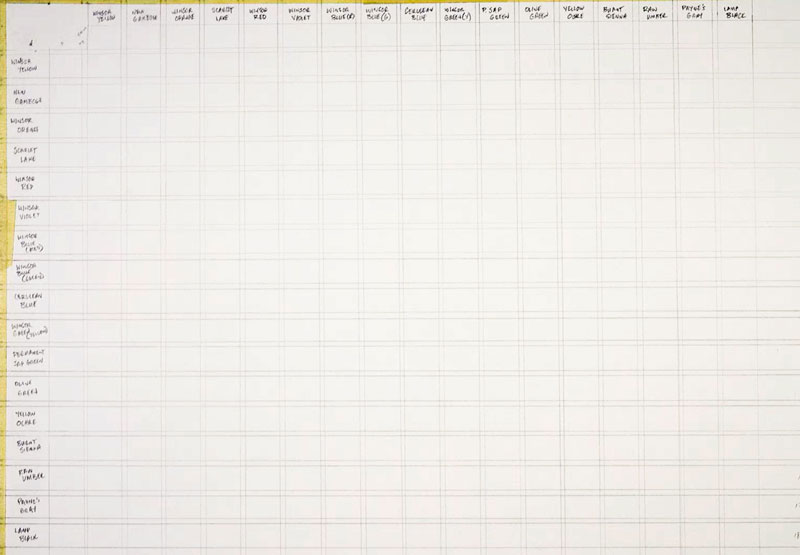
As you can see, across the top and down the left side, I listed each color. This means that each color is listed twice. The order of the colors is the same order that the colors were in when I opened my new set. I also arranged the colors in the same order on my palette to avoid any confusion.
I left open spaces between each color and mixture so that I could see the contrast against the white paper. You’ll have to do some measuring to create your grid based on how large you want each rectangle and how much space you want left open between each rectangle. Be sure to make each rectangle large enough so that you can paint comfortably.
Adding “Pure” Colors
With the grid prepared, we can start filling in colors with our paints. We’ll start with just the pure colors using water to create different intensities. These colors will fall across the top row, down the left side, and through the center.
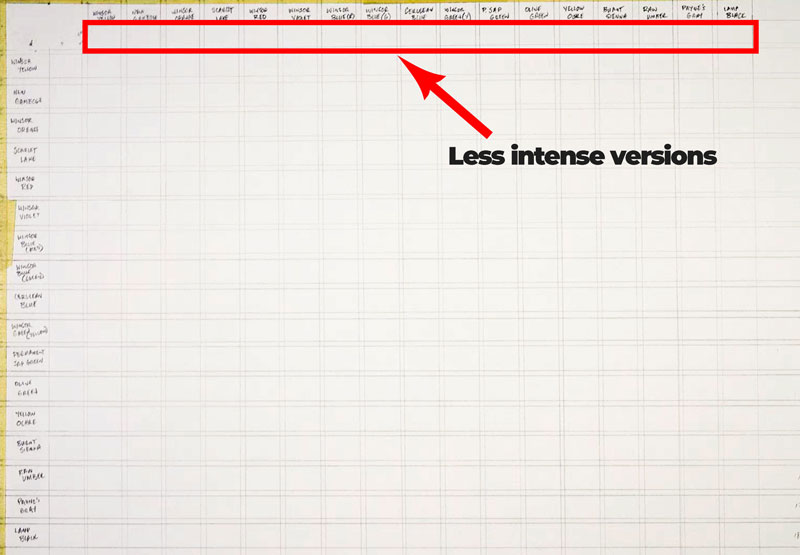
Colors across the top will be light intensities, meaning we have quite a bit of water in the mixture.
Colors in a diagonal through the middle of the grid will feature medium intensities of the color, meaning that we are using a medium amount of water.
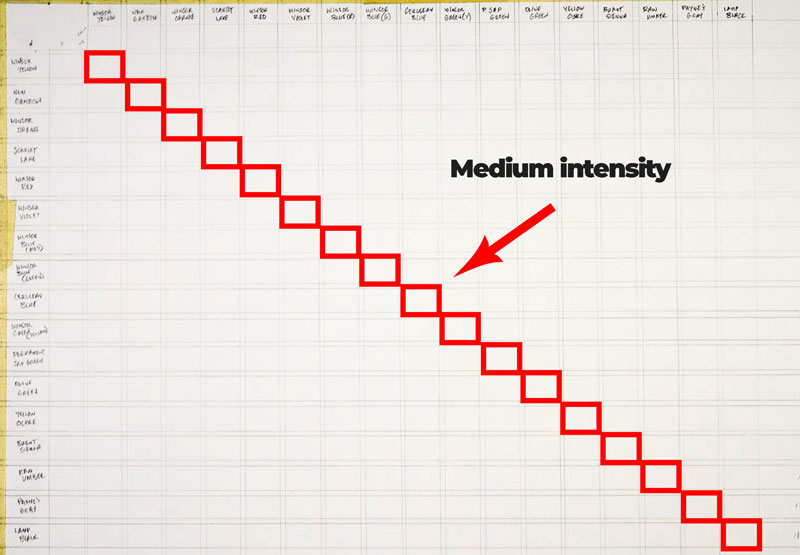
Colors down the left side of the grid will feature colors with a strong intensity, meaning that we will use just a little water.
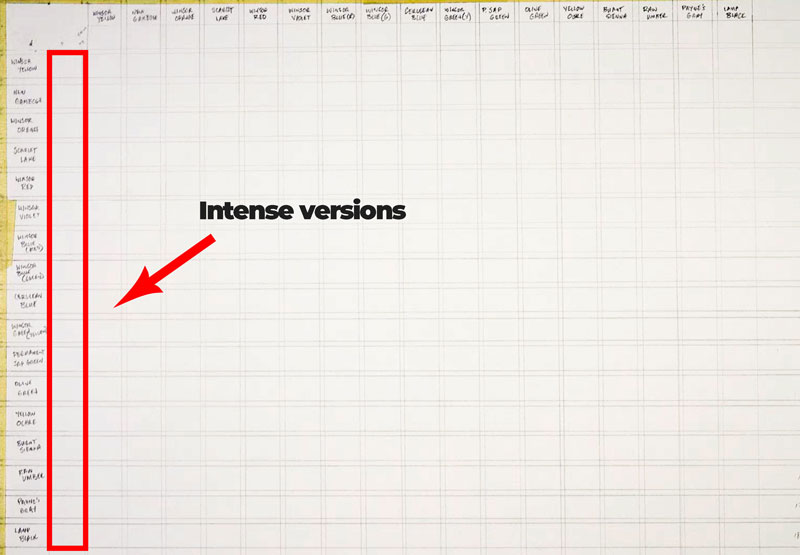
Adding Mixtures to the Chart
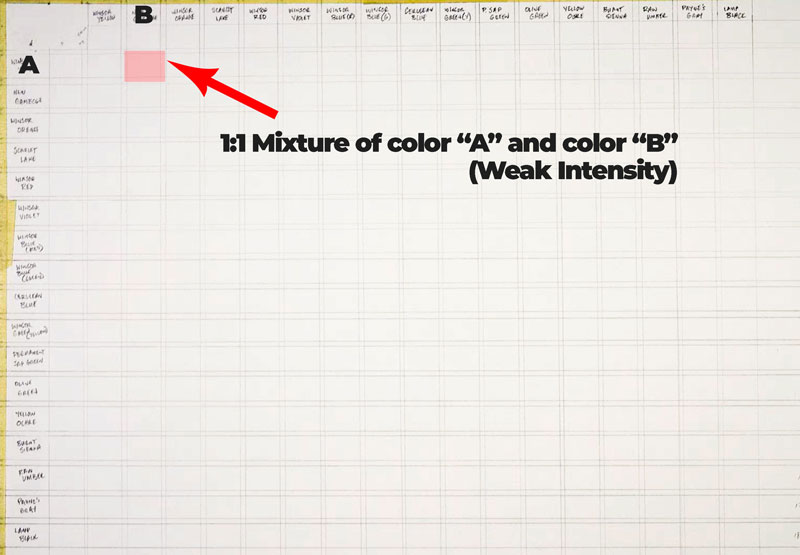
With our pure colors and intensities in place, we can now begin creating mixtures of colors to fill in the rest of the chart. Our mixtures will consist of equal parts of each color. We’ll use water to create different intensities of the colors.
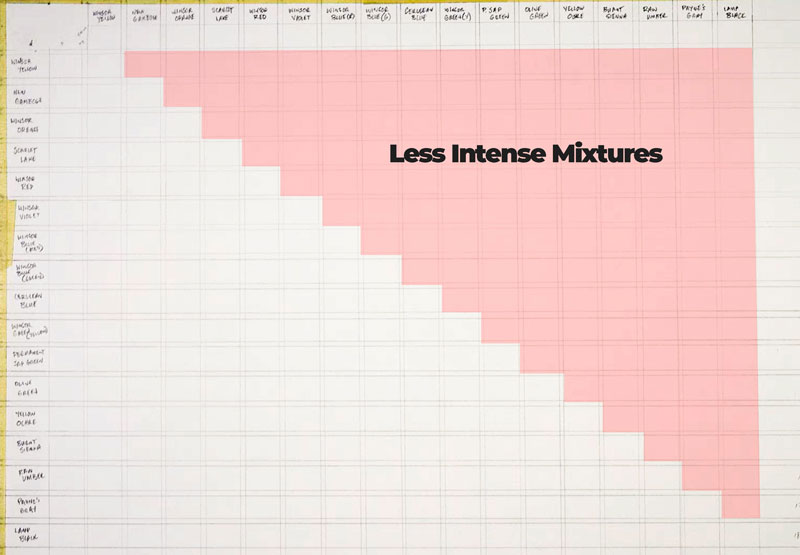
As you may expect, we’ll simply mix the two colors that are found along the top and the down the side to fill in each rectangle. Colors that are found on the upper right half of the grid will be less intense versions of these mixtures. This means that after mixing the color, we’ll add a bit more water to create a less intense version of the color.
For color mixtures within the lower left half of the grid, we’ll create a more intense version. This means that we’ll use less water.
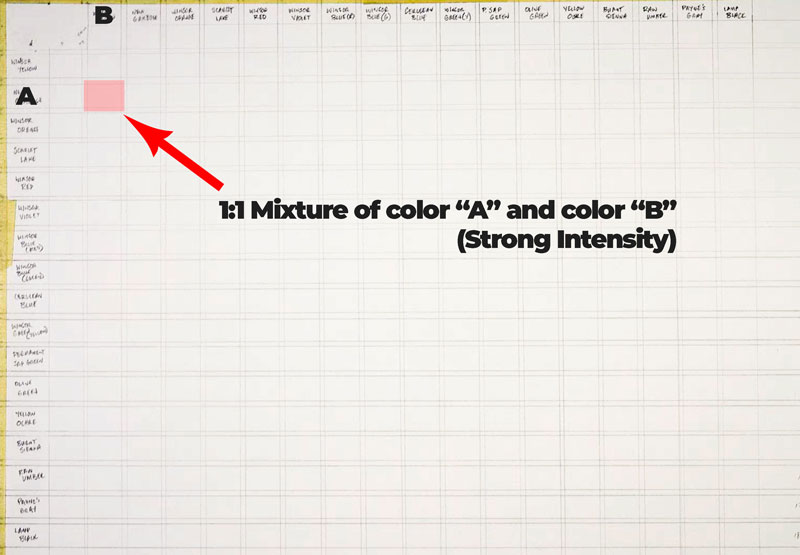
This part of the process is slow and tedious. Just take your time and enjoy the process.
Once you have filled in the mixtures, you’ll see that the less intense versions of these mixes are found in the upper right corner of the grid.
The more intense versions of your mixtures will be found in the lower left corner of your grid.
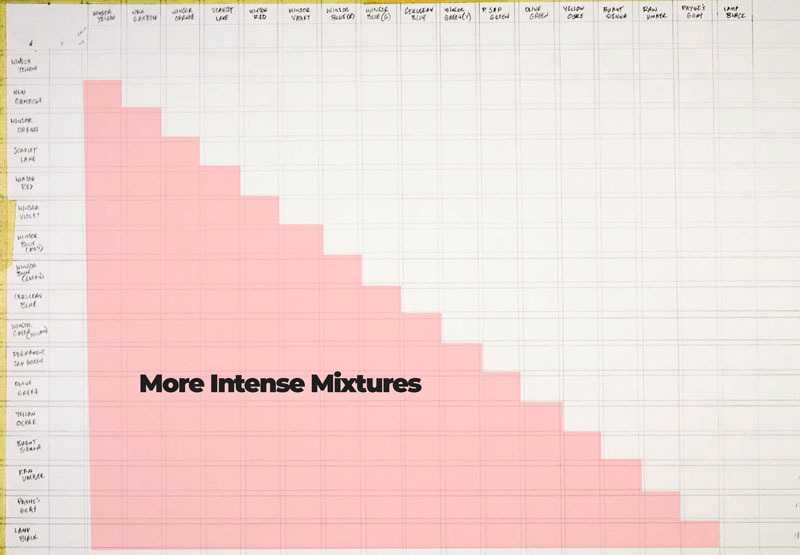
By laying out your grid in this manner, we end up with two different versions of your mixtures – one with less intensity (likely lighter in value) and one with strong intensity (likely darker in value). It’s amazing how different a light intensity version and strong intensity of the same color can be.
Making a Watercolor Chart Conclusion
Watercolor mixing charts make it easier to find the color that you need. Just use the chart that you make as a reference and save the time of experimenting on your palette. You’ll also discover new colors and color mixtures that may be unexpected. Creating a watercolor chart is not just a process of making a tool for you to use. It’s also a great exercise to practice mixing and controlling your paint applications. So, if you’re stuck between projects and are currently lacking inspiration, why not make a watercolor chart?
If so, join over 36,000 others that receive our newsletter with new drawing and painting lessons. Plus, check out three of our course videos and ebooks for free.

